Solar for business
High Power Bills at Work: Building a Business Case for Commercial Solar
Turn a high business electricity bill into a decision you can check. Separate energy and demand charges, model usable solar output and compare ownership costs across realistic scenarios.
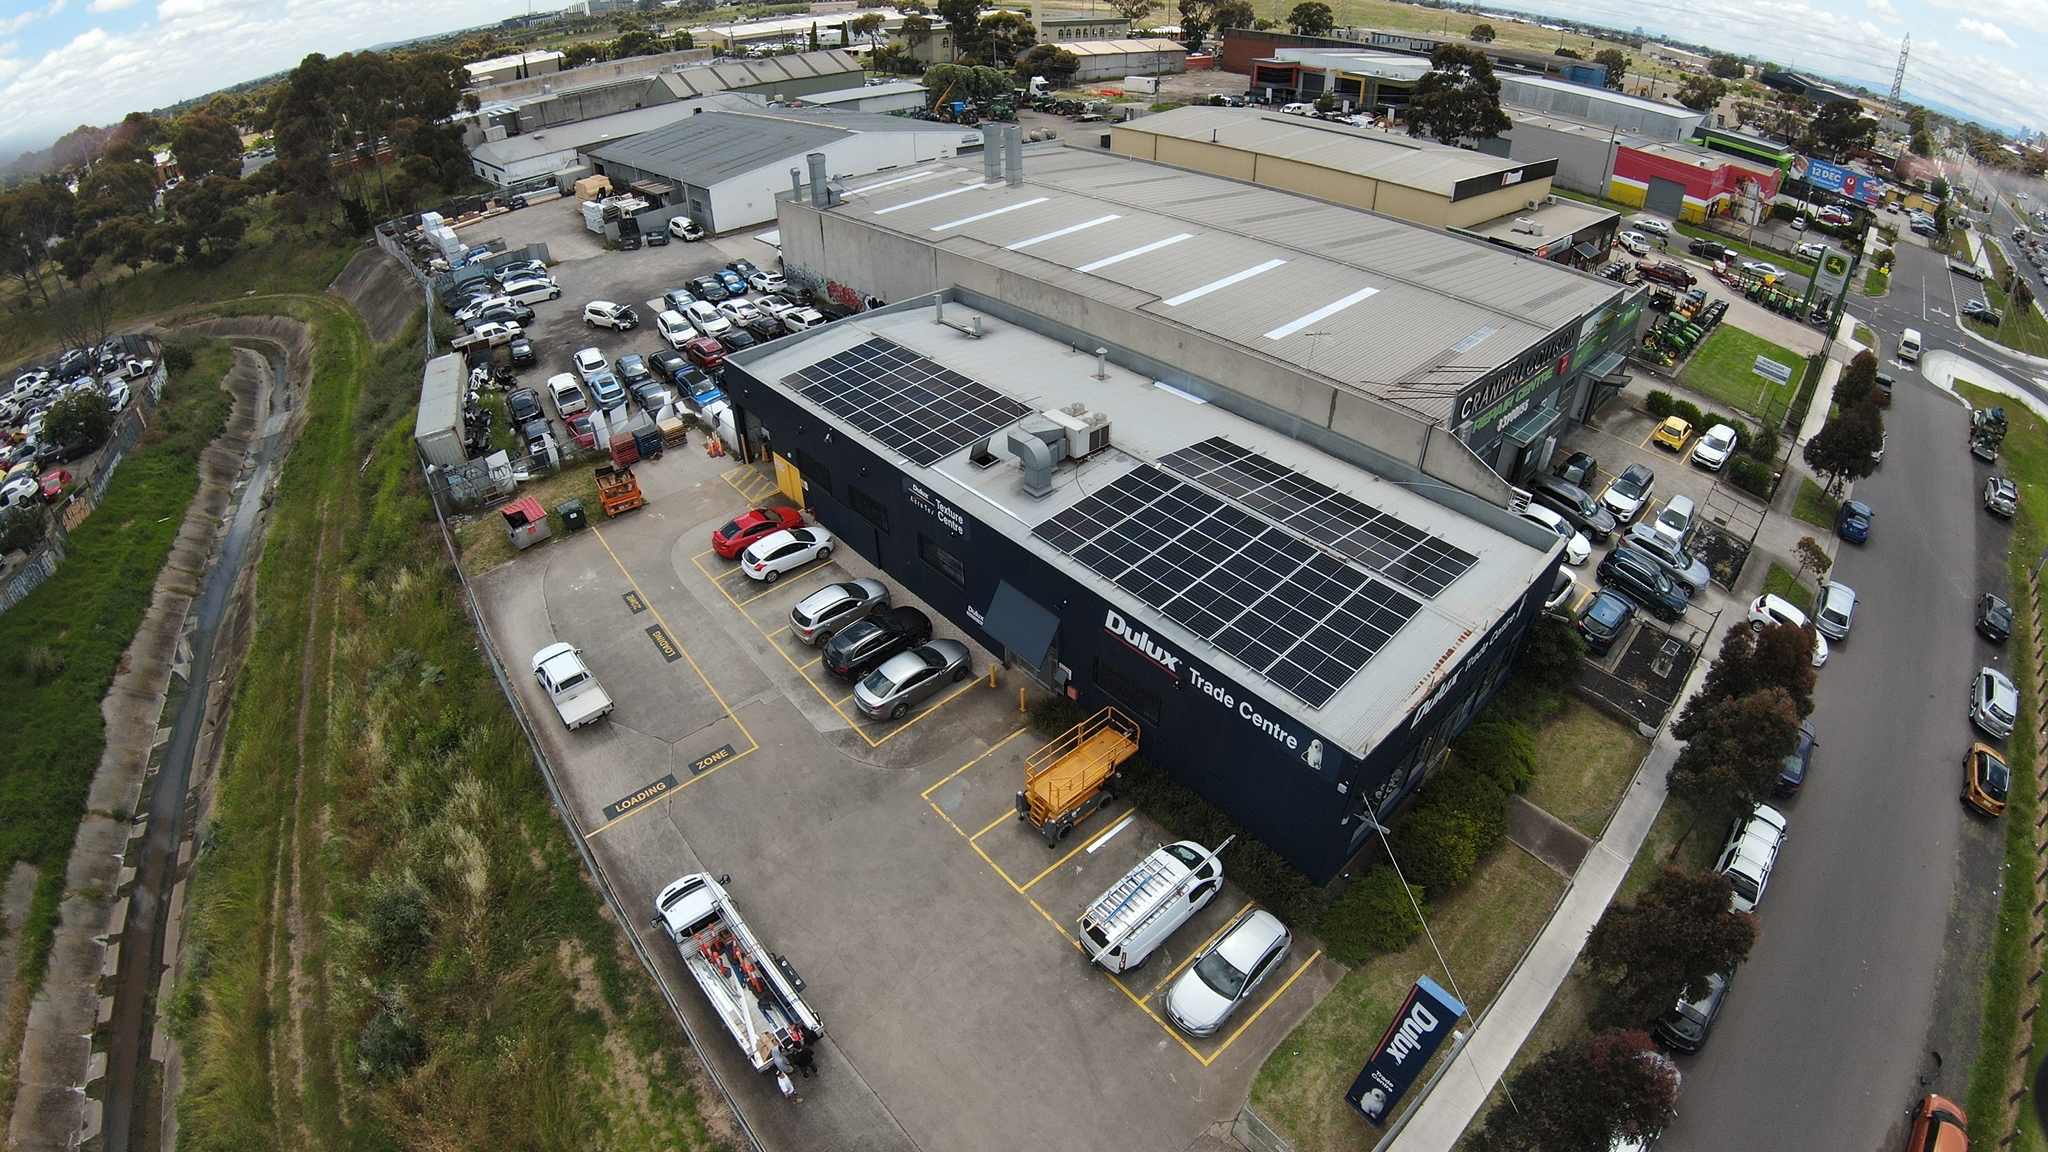
A rising electricity bill can make solar feel urgent. For a business owner, the useful response is a calculation that explains where the benefit comes from, when it arrives and what could reduce it. The roof may look promising, but the decision also competes with stock, equipment, staffing and other uses of cash. Para sa negosyo, kailangang malinaw ang numbers.
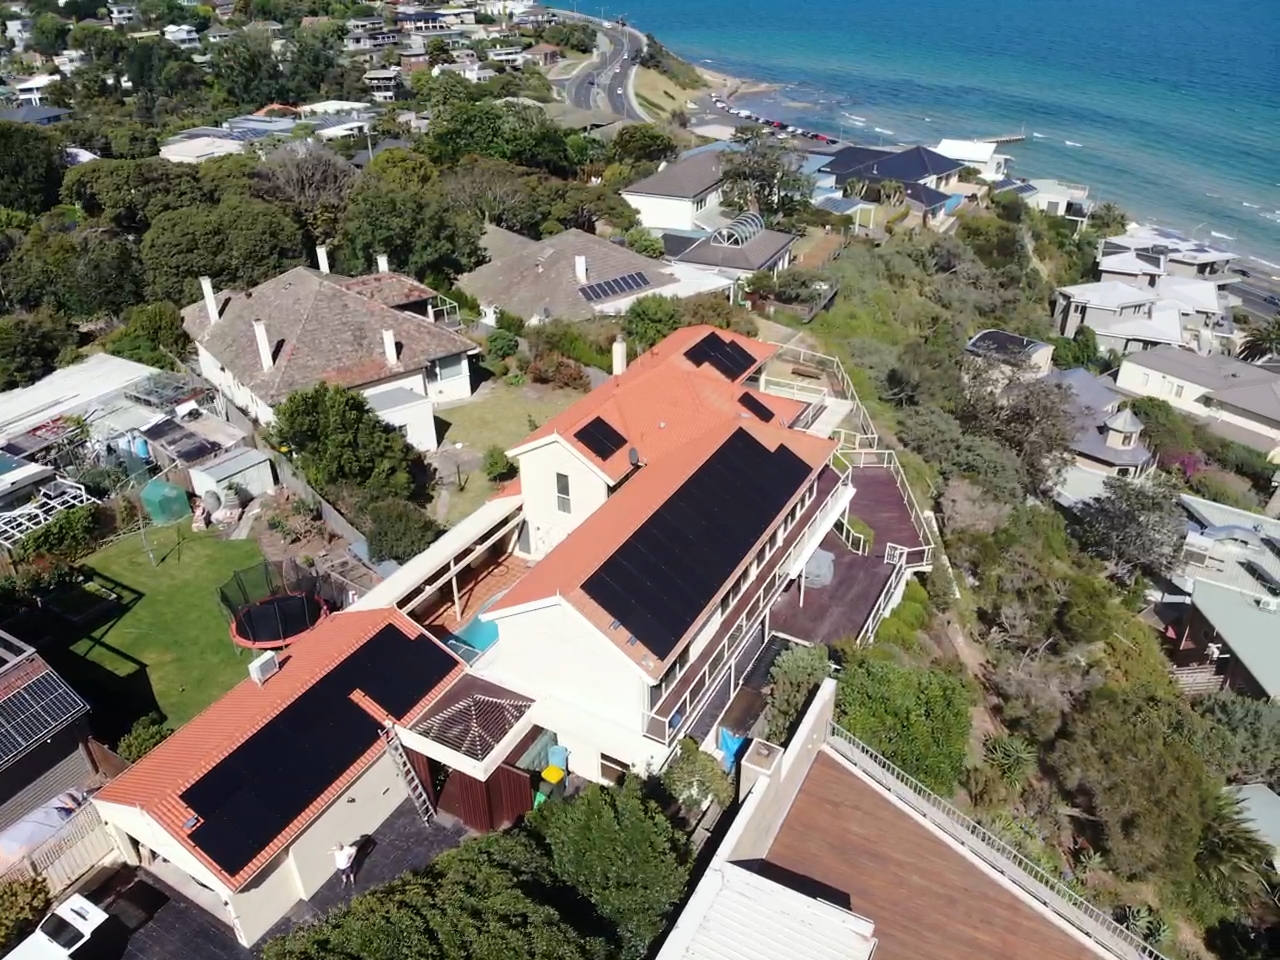
MSpectrum’s solar overview points to daytime business activity as a potential fit for rooftop generation. [1] Turning that opportunity into a business case requires more detail: your tariff, operating pattern, usable output and contractual commitments. Let’s work through those pieces without inventing an installation price or assuming the whole bill disappears.
1. Establish the bill you are trying to change
Collect twelve months of electricity bills if available, the current supply agreement and interval demand data. Note which months involved closures, extra shifts or unusual equipment use. Start with a baseline that describes the operation you actually expect, then identify planned changes separately. An exceptional month is rarely a sound basis for a multiyear investment.
Meralco’s business-bill presentation distinguishes energy consumption in kWh from demand in kW and identifies minimum billing demand. Its illustrated historical bills explain the structure, not today’s price for your account. [2] Ask the account provider to confirm the current tariff and how each charge is calculated. If your business buys power under a separate supply arrangement, include those terms. Dividing the entire bill by total kWh produces an average, but that average may include amounts that will not fall when solar reduces energy purchases.
2. Separate energy savings from demand savings
Energy is the quantity of electricity used over time. Demand describes power drawn during the measurement intervals relevant to the tariff. A site can buy fewer kWh after installing solar while its billed demand changes little. The crucial question is when the bill-setting peak occurs and how the tariff treats minimum or contracted demand.
Consider a hypothetical workshop whose highest grid demand happens during an evening production run. Daytime solar can reduce afternoon energy purchases without reducing that evening peak. Even a daytime peak needs interval modelling: clouds, equipment starts and the tariff’s calculation method matter. SAM’s commercial modelling guidance treats energy charges, demand charges and fixed charges separately, and requires load data for demand-charge analysis. [3] Until that analysis demonstrates otherwise, use zero demand-charge savings in the base case. Any supported benefit can then appear as a separate line, with its assumptions documented.
3. Build a worked example without guessing prices
The following is an invented operating scenario for explaining the arithmetic, not a customer result or generation forecast. Assume a business currently uses 120,000 kWh annually. A proposed array has 60,000 kWh of modelled annual production potential, and matching generation to the load suggests 80% could be used directly. For this simplified zero-export case, assign no value to the unused potential, assume no battery and count no demand-charge reduction.
Direct solar use is 60,000 × 80% = 48,000 kWh. Holding business consumption unchanged, grid energy purchases would be 120,000 − 48,000 = 72,000 kWh. The remaining 12,000 kWh of production potential is curtailed in this illustration; it is not credited as bill savings.
Let R be the average avoidable energy charge in pesos per kWh, calculated from the business’s actual tariff for the relevant hours. Gross annual energy savings are 48,000 × R. Let O represent the routine annual operating costs borne by the owner. The simplified annual operating benefit is then 48,000R − O. Insert verified rates and written cost allowances before reporting a peso result. Where rates vary by time or consumption band, calculate each applicable interval or band rather than relying on one R.
4. Test the assumptions that can move the result
Now suppose daytime activity falls and the usable share is 60%, with the same 60,000 kWh production potential. Direct use becomes 36,000 kWh and the simplified operating benefit becomes 36,000R − O. That is 12,000R less each year than the original case, even though the panels and roof are unchanged. The difference comes from how the business uses electricity.
A separate lower-output scenario can test a 10% reduction in production potential while retaining 80% direct use: 54,000 × 80% = 43,200 kWh. These percentages are illustrative tests, not predictions about a site. Ask the modeller to choose defensible sensitivities using actual evidence. Also test a lower avoidable tariff, a longer shutdown and delayed commissioning. Record which variables change together, so a combined downside case does not quietly mix incompatible assumptions or count the same loss twice.
5. Move from annual benefit to a cash-flow decision
Let C be the complete installed capital cost from a written proposal. A simple screening payback is C divided by 48,000R − O, provided that annual benefit is positive. That shortcut assumes the annual benefit stays constant and leaves out timing effects. It cannot describe every replacement, financing payment or change in operating conditions over the project’s life.
Build a year-by-year cash-flow schedule for the actual decision. Include the initial investment, expected operating benefits, maintenance, replacement expenditure and end-of-term obligations. Use a consistent treatment of tax and VAT with the business’s accountant. If borrowing is involved, distinguish project economics from the owner’s equity cash flow; do not charge the full financed capital and loan principal twice. SAM’s financial models use annual cash flows to calculate measures including net present value and internal rate of return. [4] Those measures are useful only when the inputs and the business’s chosen discount rate are explained.
6. Compare purchase, lease and energy payments fairly
Outright ownership places the investment and agreed ownership costs with the buyer. A lease typically involves scheduled payments for the equipment arrangement. Under a power purchase agreement, payments relate to energy under the contract’s pricing and metering terms. SAM distinguishes these ownership models when evaluating the building host’s costs and benefits. [5] Their availability and requirements for a Philippine site must be checked for the specific offer.
Use the same operating assumptions across options. Compare deposits, annual payments, escalation, service duties, minimum commitments, buyout rights and removal or transfer costs. Clarify whether payments cover generated electricity, delivered electricity or another defined quantity. A business with seasonal closures should understand what it owes when demand is low. Also check the remaining property lease term. A modest first payment does not settle whether a long commitment fits an uncertain occupancy plan.
7. Put technical and operating risks into the model
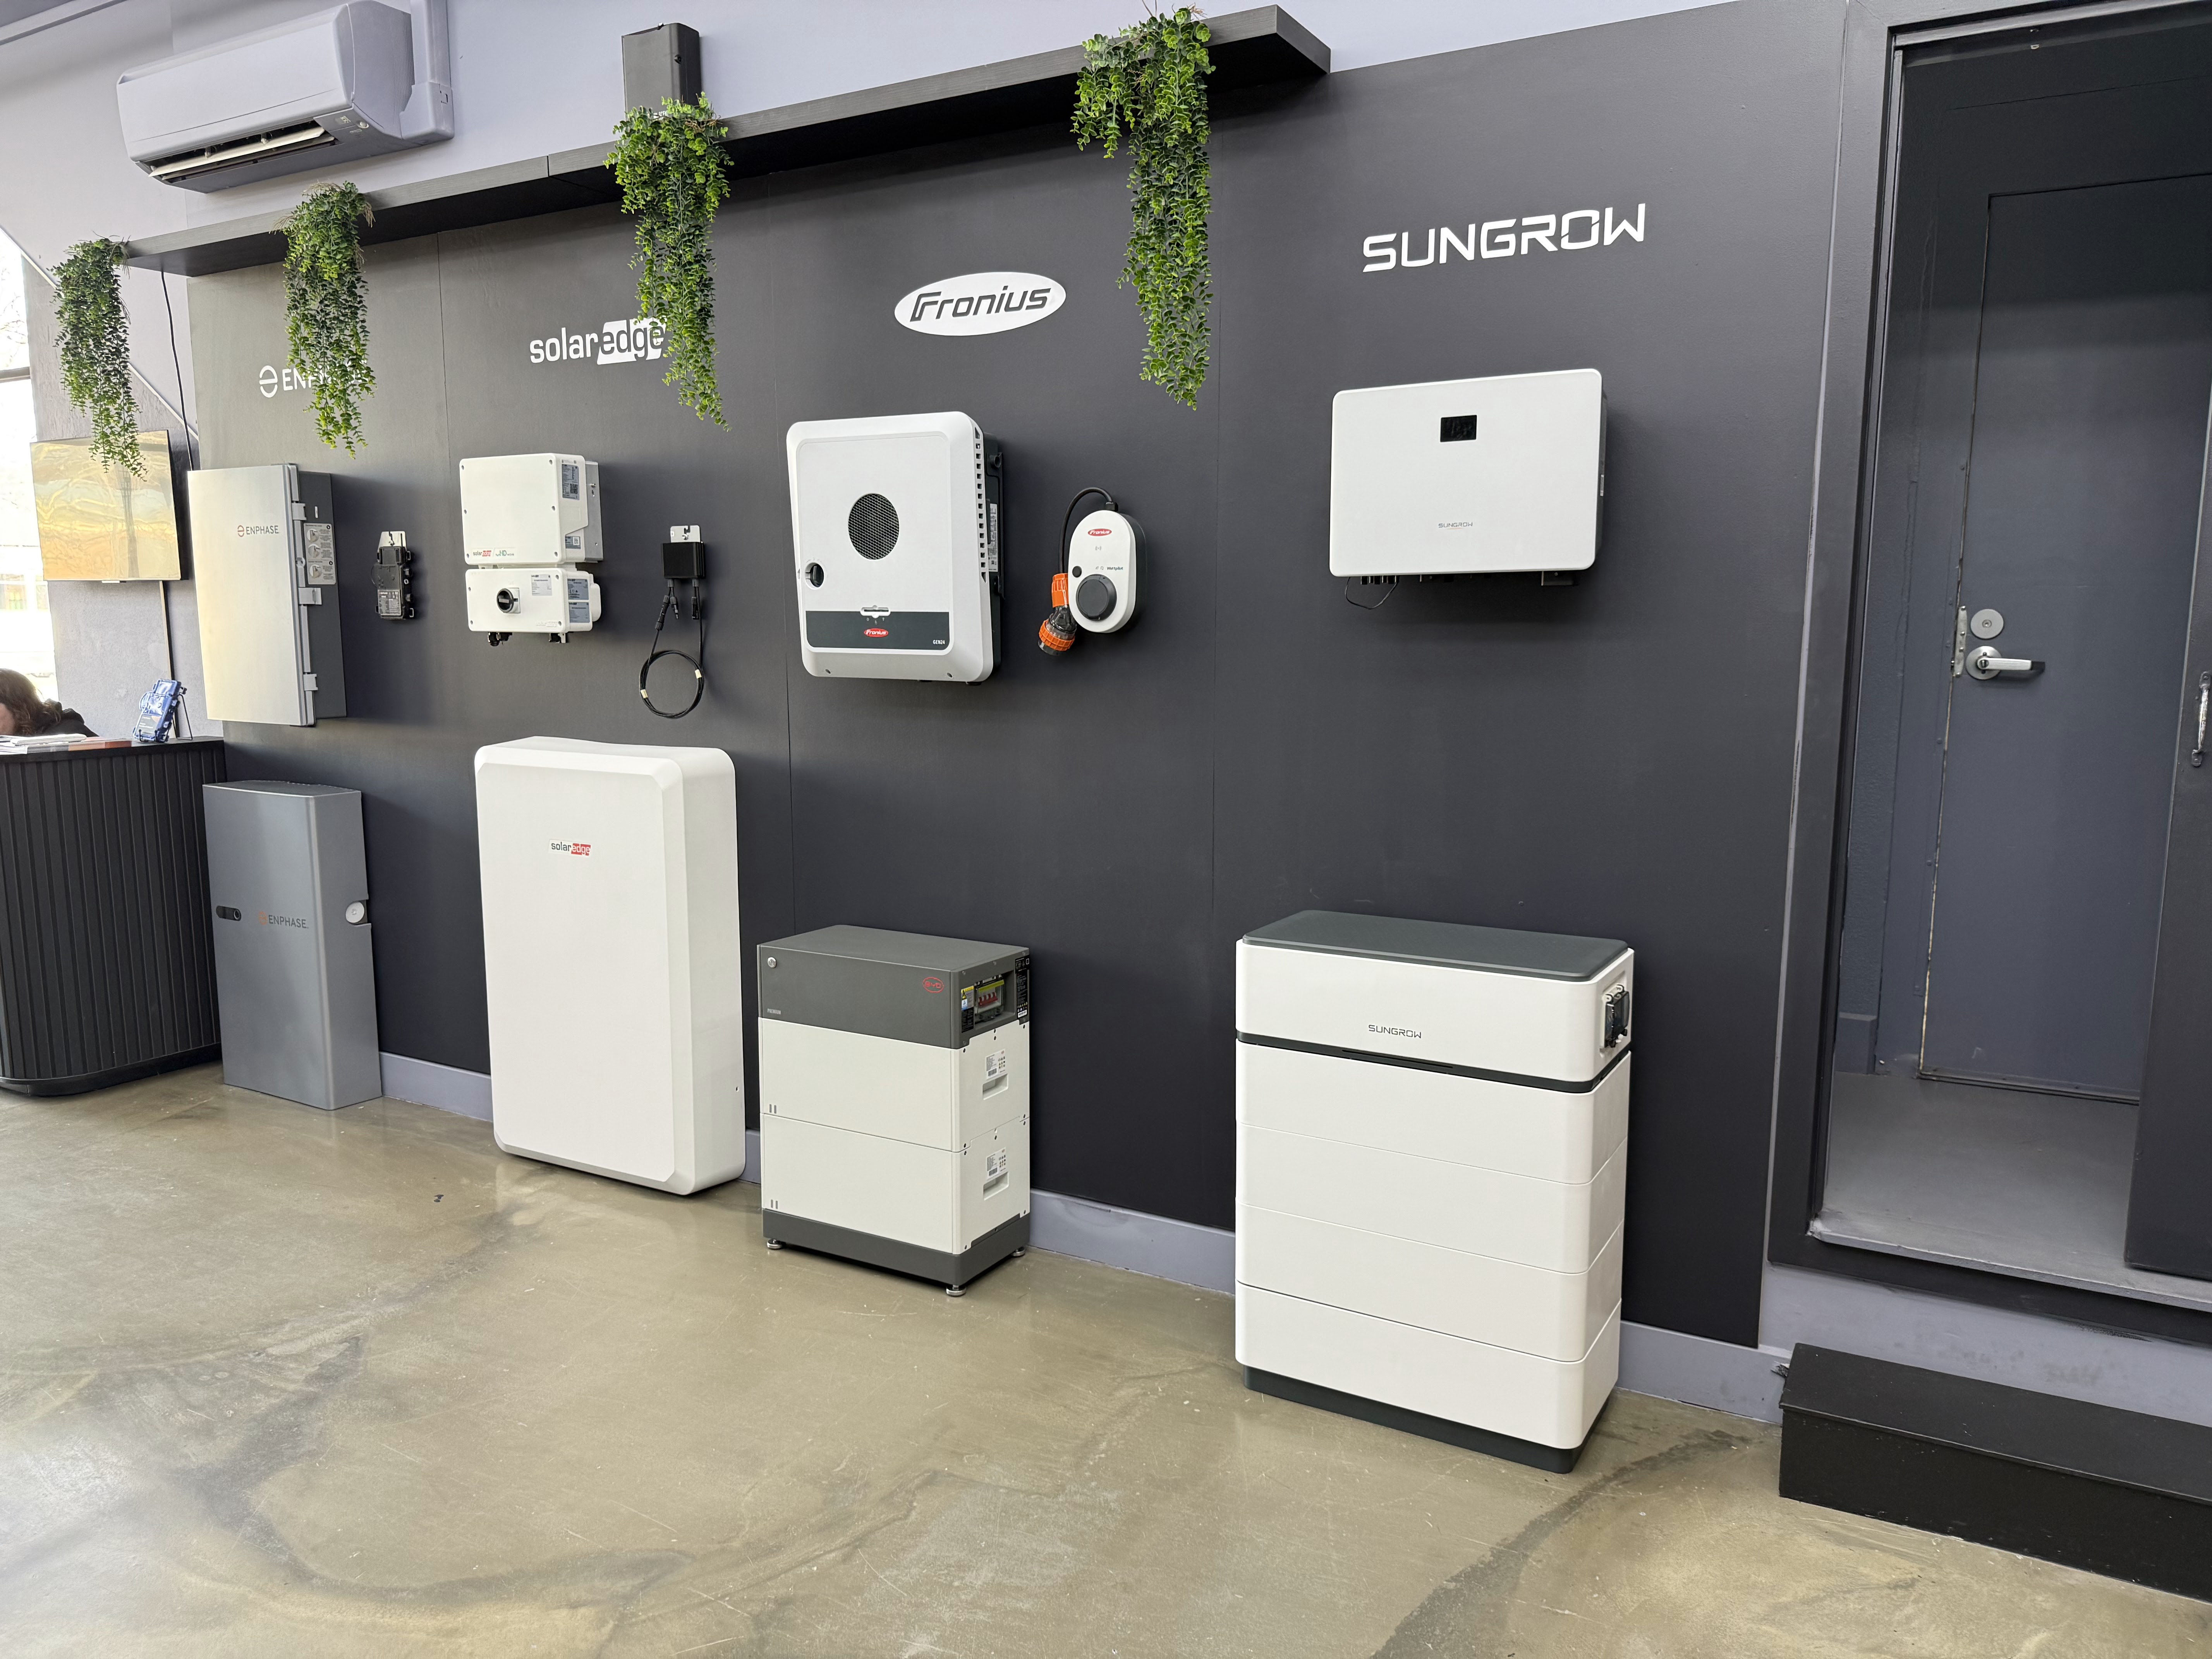
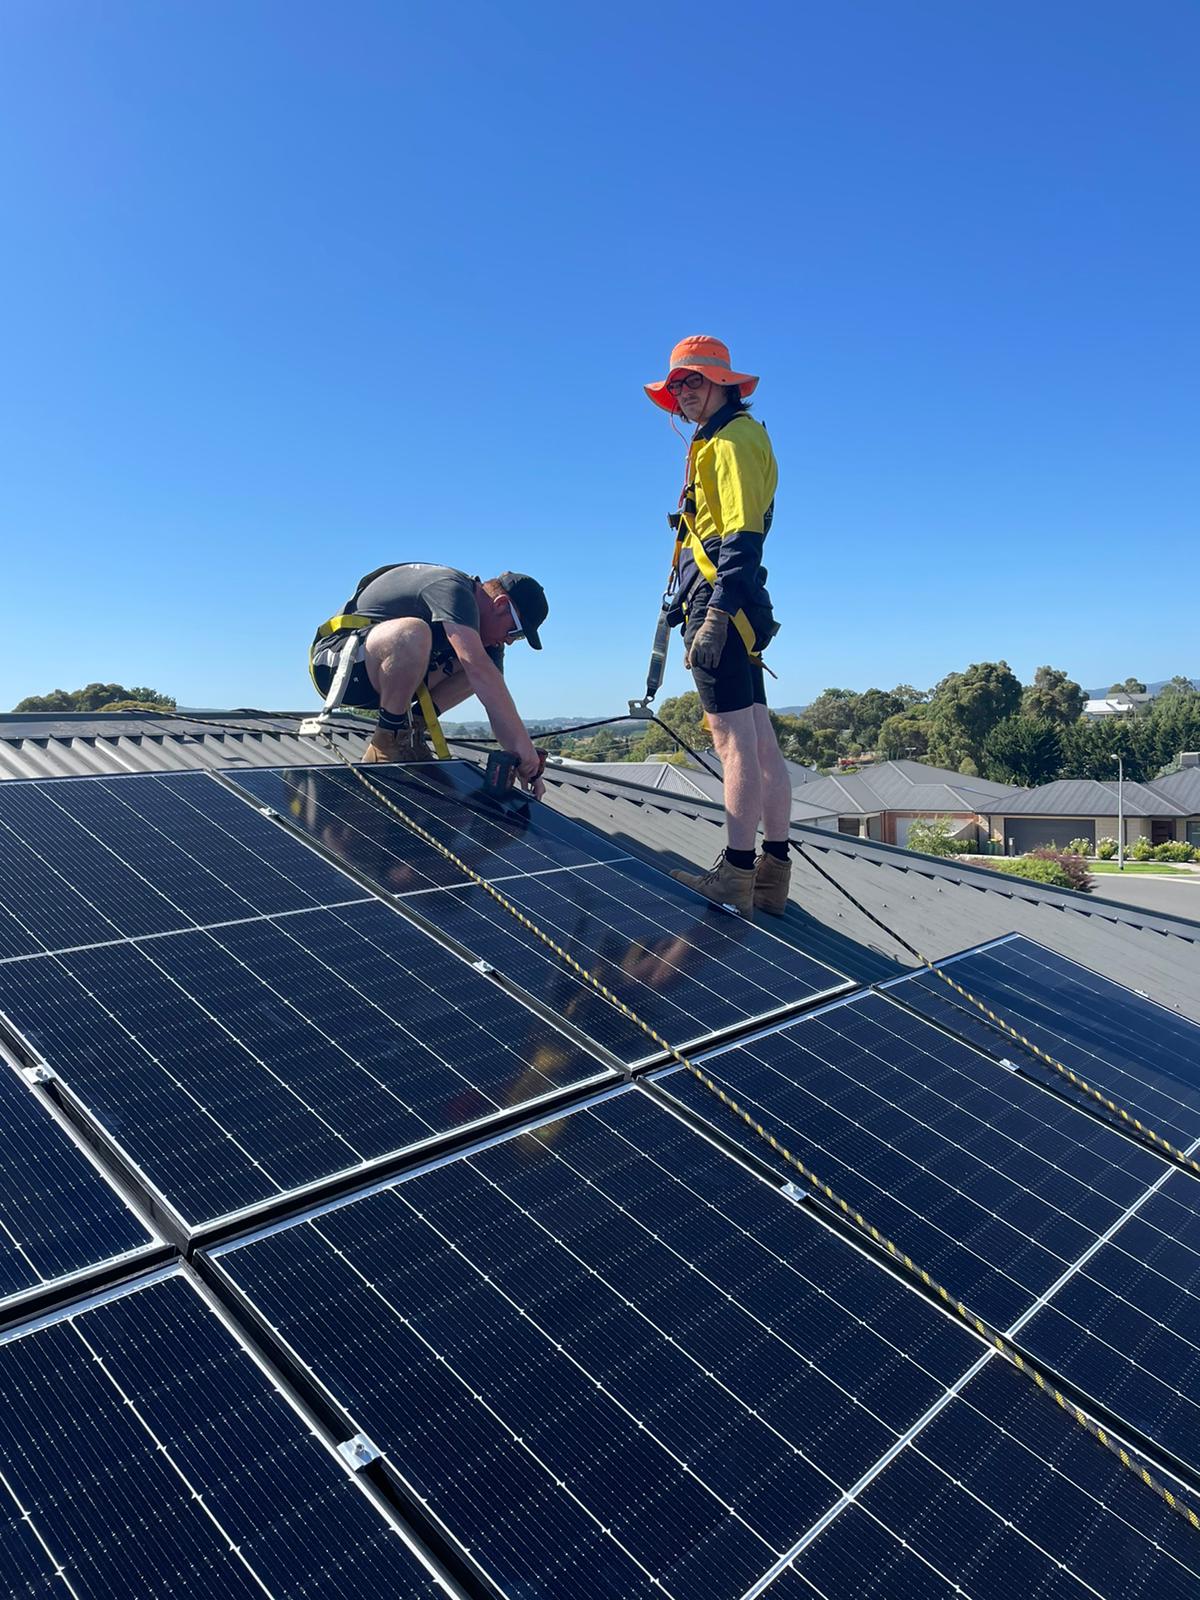
An attractive energy calculation still needs a roof and electrical system that support the installation. Identify required roof repairs, structural assessment, access arrangements and any electrical upgrades before treating C as complete. Ask what happens to production and costs during future roof work. These are operating assumptions with financial consequences, not merely installation details.
Keep business continuity in a separate part of the assessment. Grid-connected panels alone should not be valued as guaranteed brownout protection; the necessary backup equipment and configuration must be specified. [6] If avoided downtime is part of the case, explain which processes remain powered, the duration assumptions and how the financial value was estimated. Assign someone to monitor the installed system and agree a fault-response process. Lost production that goes unnoticed for weeks can make the real result diverge from a spreadsheet that assumes continuous availability.
8. Bring management a decision they can review
Prepare a short decision paper showing the baseline, proposed system, verified price, forecast direct use and separate treatment of energy, demand and fixed charges. Present the base case beside a plausible downside case. Show annual cash flow, the analysis period, key contractual obligations and any approvals or technical issues still unresolved.
Agree how performance will be checked after commissioning: generation, direct use where measured, grid demand, service costs and changes in business activity. Review those measures against the original assumptions rather than comparing two bills without context. Bring Lightning Energy your bills, load information and commercial priorities. The next step is a site-specific proposal whose operating logic and cash requirements are clear enough for the people approving the investment to question and understand.
Sources & further reading
Sources used for this guide. Policy and product details should be checked for your particular installation.
- MSpectrum — Expanding on the Philippines’ Push for Solar EnergyAccessed 21 September 2026
- Meralco Corporate Partners — Understanding the Business Electricity Bill (presentation)Accessed 21 September 2026
- National Laboratory of the Rockies — SAM Residential and Commercial Financial ModelsAccessed 21 September 2026
- National Laboratory of the Rockies — SAM Financial Models and Cash FlowsAccessed 21 September 2026
- National Laboratory of the Rockies — SAM Third Party Ownership ModelsAccessed 21 September 2026
- US DOE — Solar and Resilience BasicsAccessed 21 September 2026