
Solar FAQs
Is a Flat-Topped Solar Graph a Fault or Inverter Clipping?
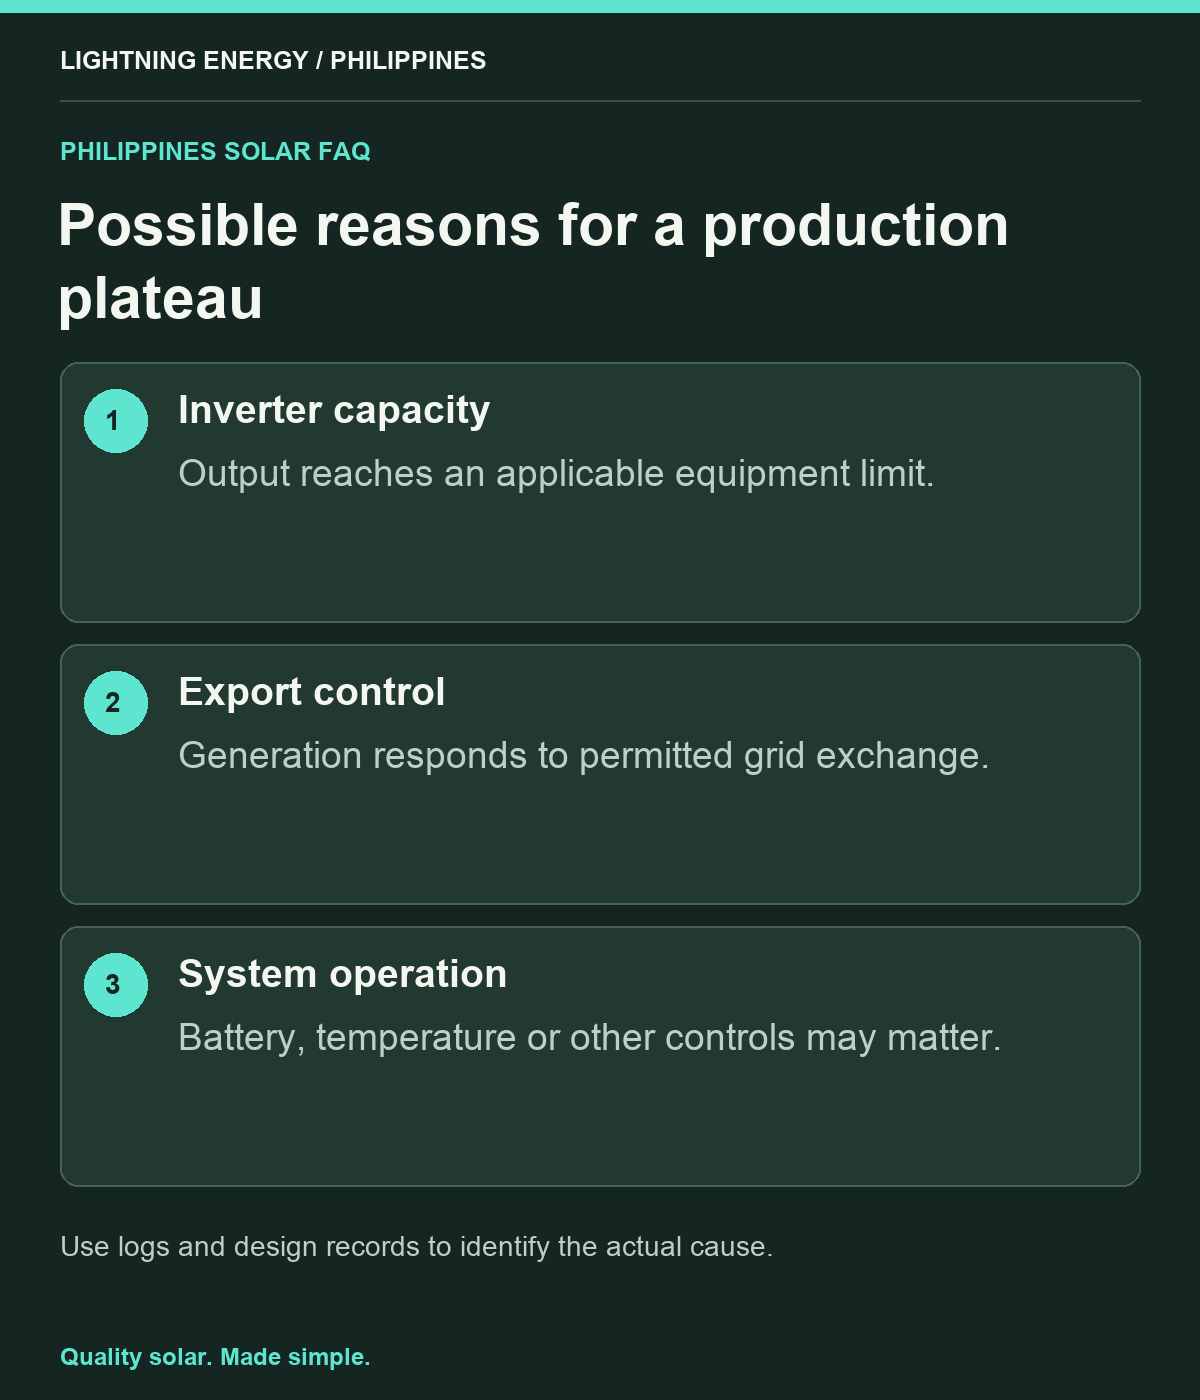
A production plateau can have several causes. Identify inverter limits, export controls and operating conditions before changing equipment.
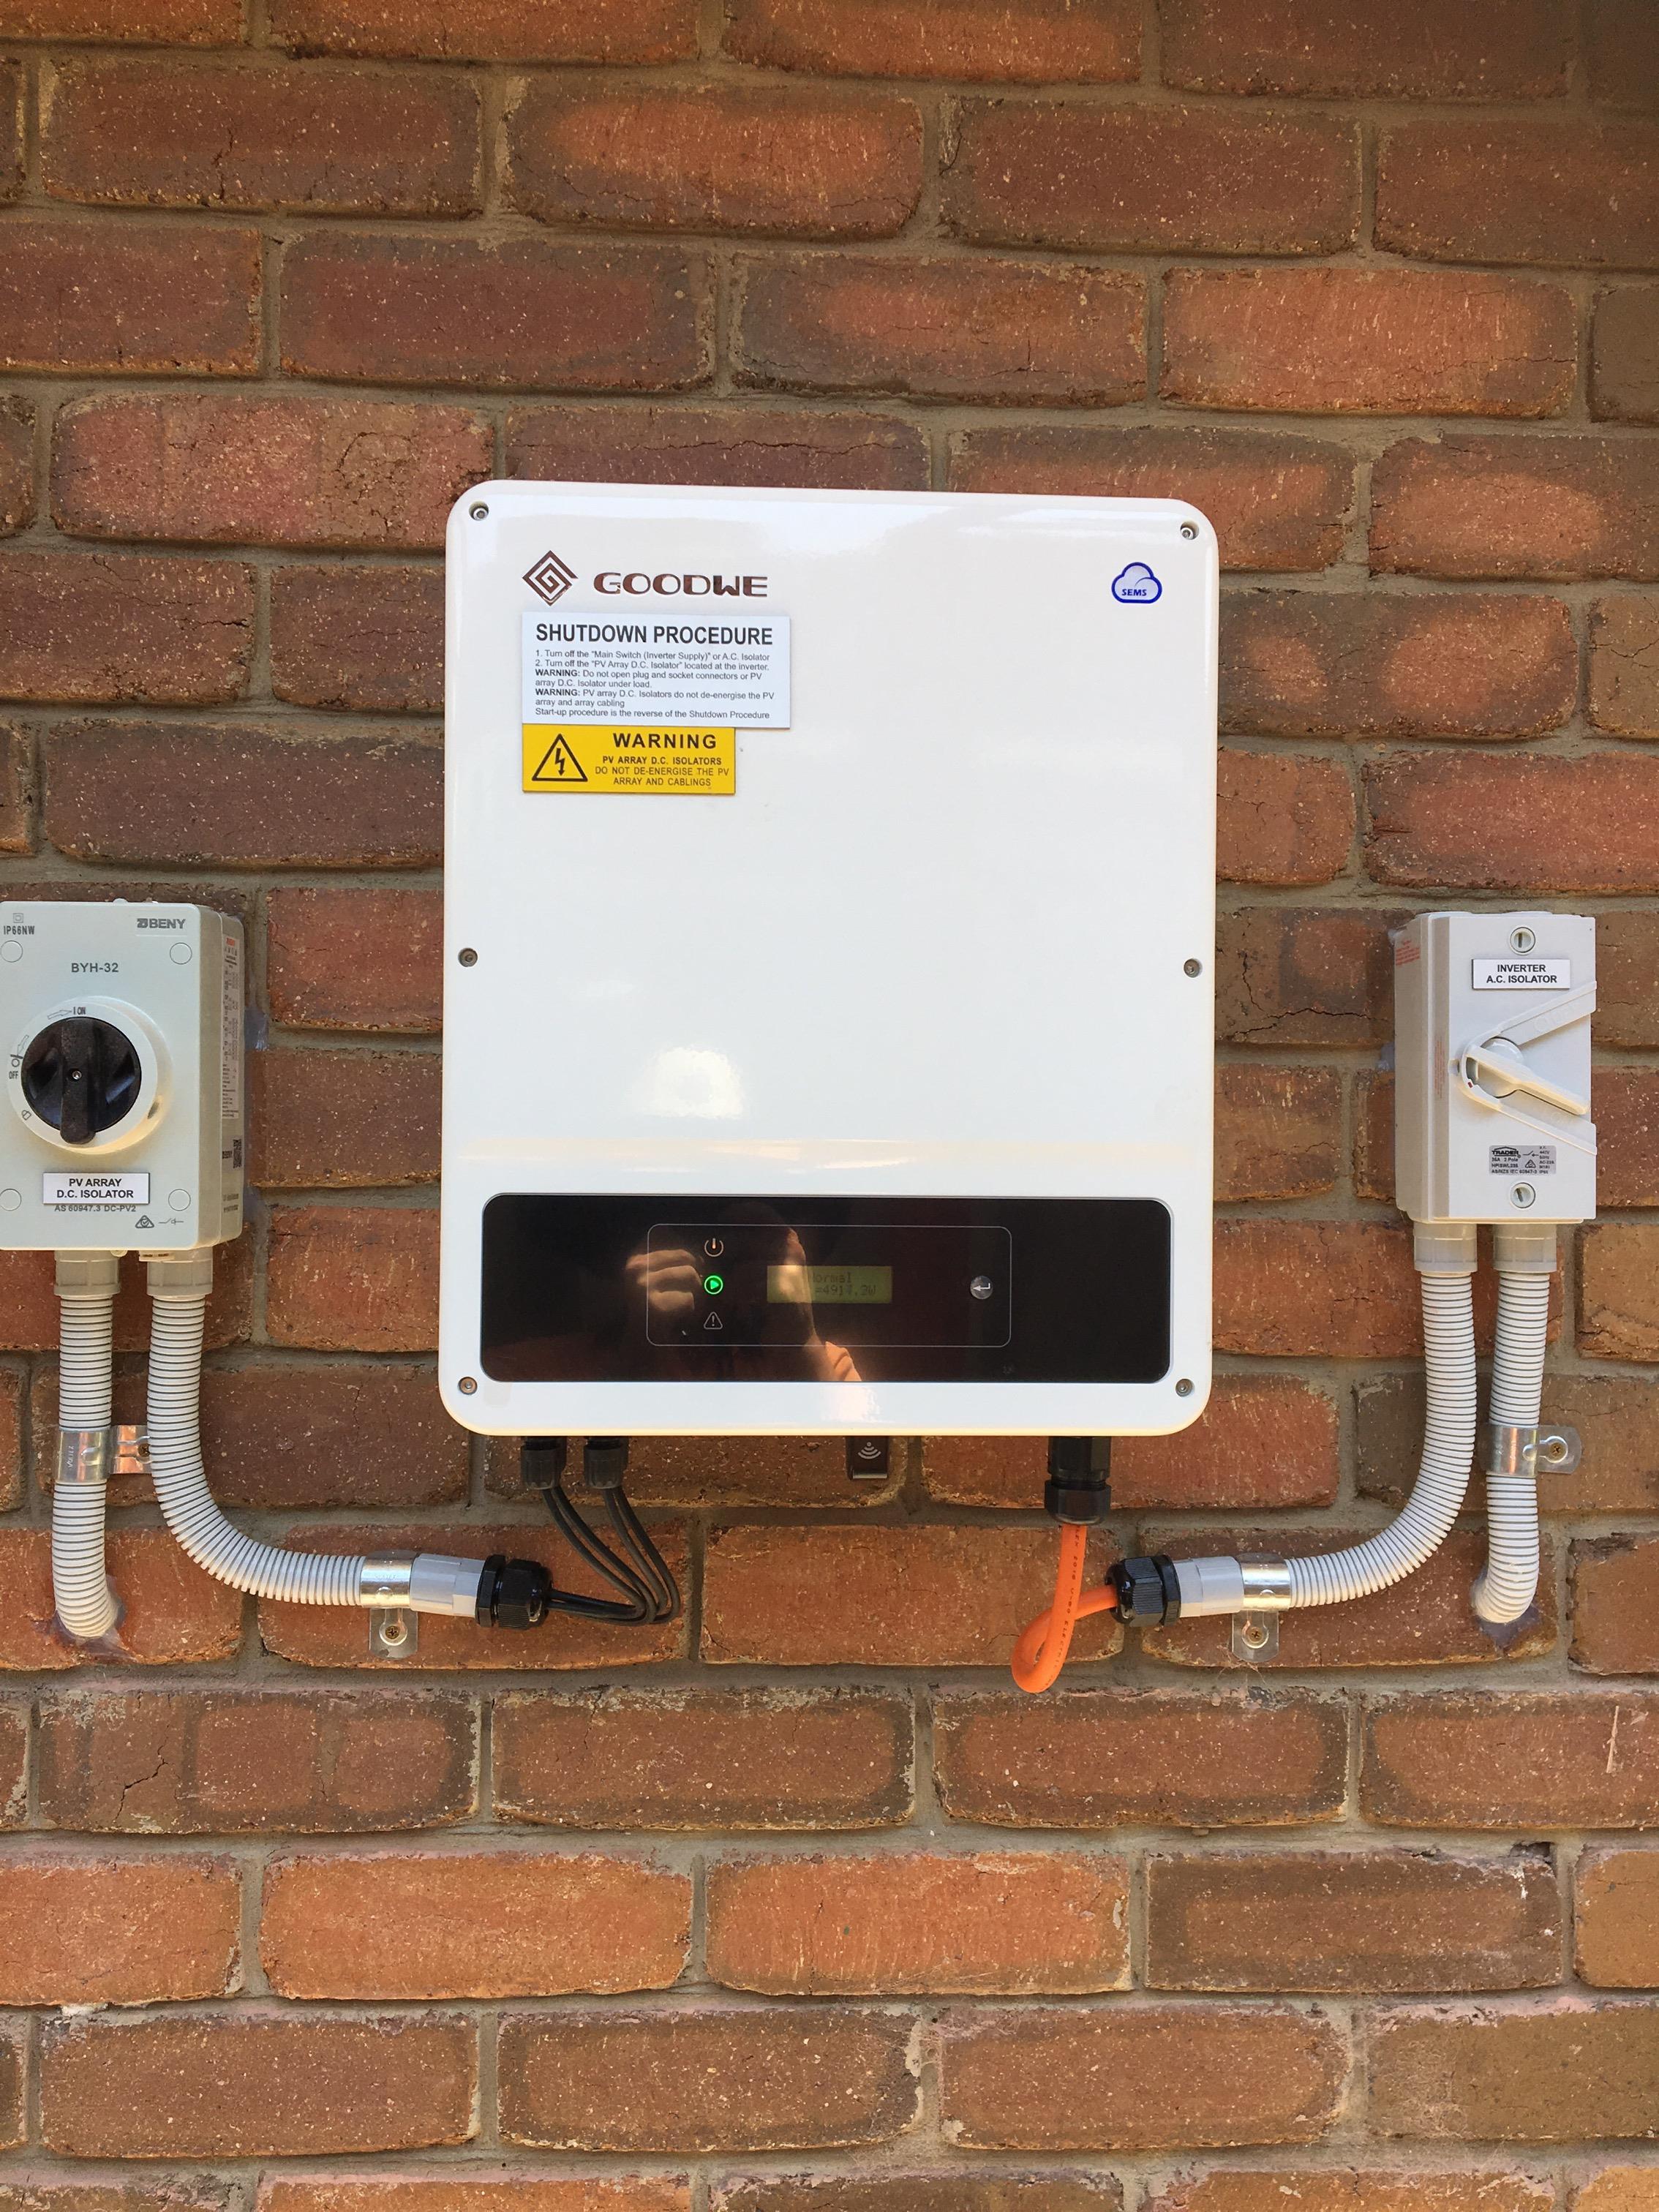
A flat-topped production graph can be normal power limiting, but its shape alone does not prove the cause. It may reflect inverter clipping, an export setting, battery controls or another operating limit. Ask the installer to explain the plateau using the system design and event records before assuming that the panels or inverter are faulty.
Understand what clipping means
The SAM modelling documentation describes power clipping when potential inverter output exceeds its AC rating and output is limited accordingly. [1] It also distinguishes voltage-related limits, so not every constraint is the same phenomenon.
Find the panel-array DC capacity and inverter AC rating in your quotation. They do not have to be identical, but their relationship should be deliberate and within manufacturer limits. Ask whether the forecast includes clipping and how much annual energy it estimates is affected. Do not judge the design solely by the highest number shown on a sunny afternoon.
Check whether another control is active
Ask if the system is configured for zero export, an agreed export limit or battery-priority operation. A low household load and a full battery can create a different limitation from inverter capacity. The installer should identify the relevant operating mode and its expected effect on the graph.
Record the time of the plateau, house demand, battery state and any alarms. If the app does not show all those values, say so rather than filling gaps with guesses. Never increase export or protection settings yourself to make the curve look smoother or obtain a larger screenshot peak.
Compare energy, not only the clipped peak
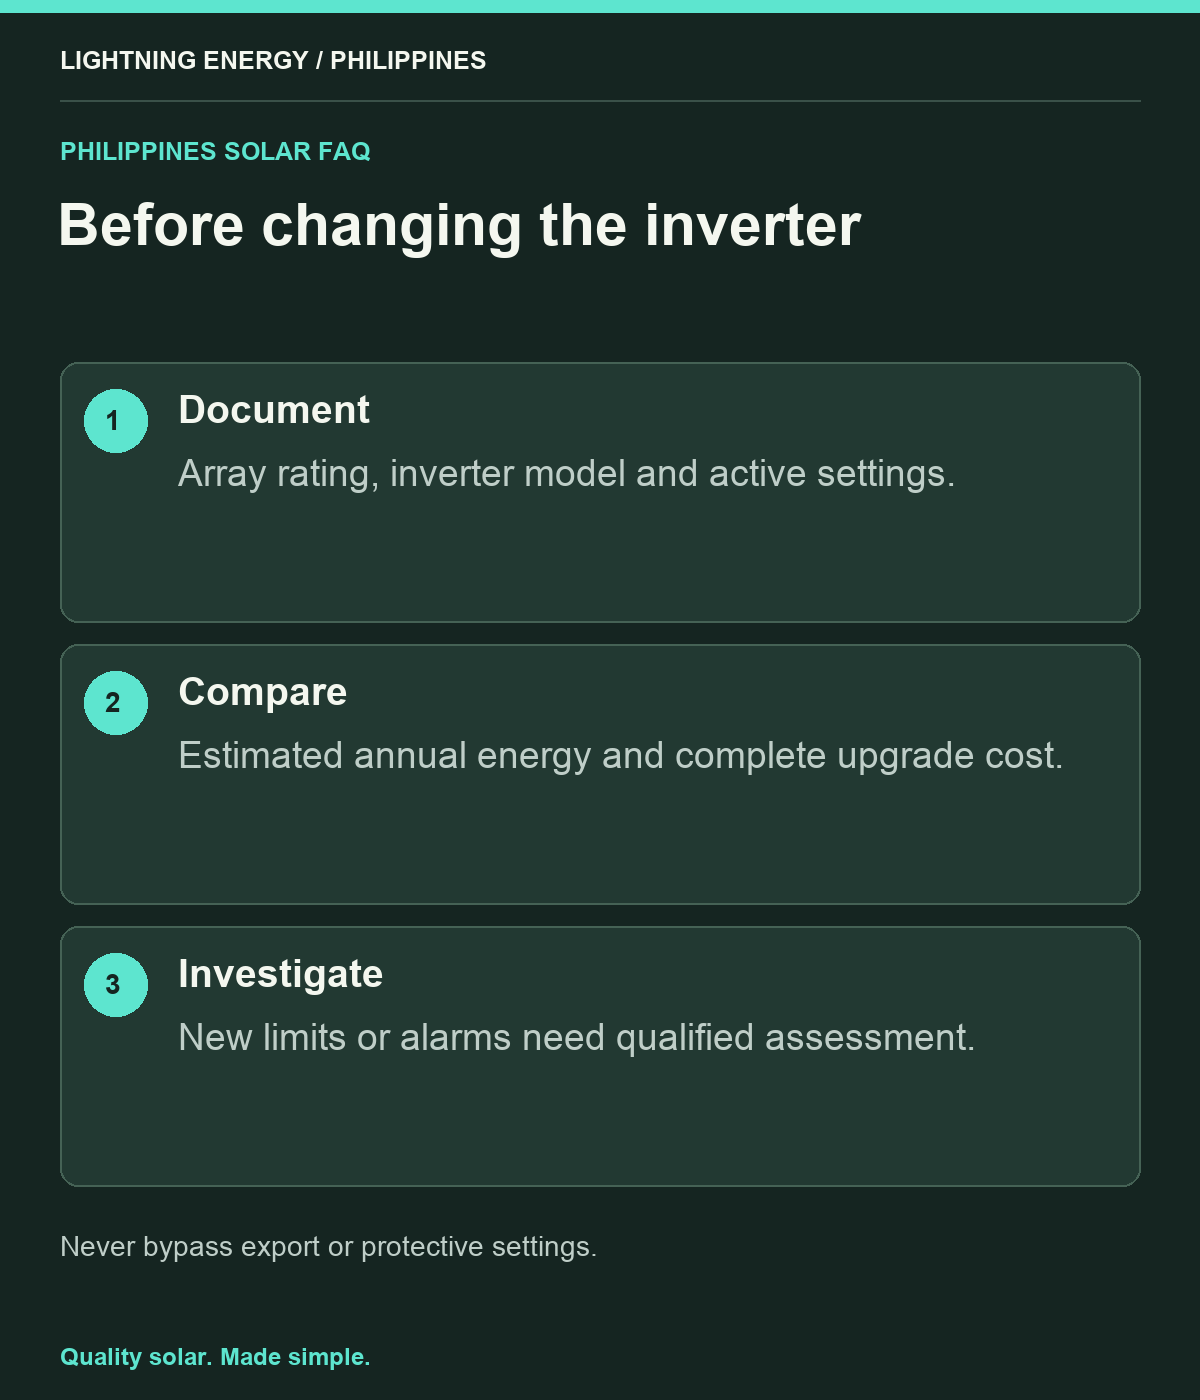
A design comparison should examine annual or monthly energy and complete cost. The apparent area missing from one graph can look dramatic without establishing the value of a larger inverter. Ask for a consistent comparison using the same array, weather data and roof assumptions.
PVWatts cautions that forecasts depend on model assumptions and uncertainties. [2] Treat a precise clipping estimate as a modelled result to review, not an independently measured guarantee. Ask whether the model captures the time resolution and equipment behaviour relevant to the proposed system.
Use an illustrative capacity example
Imagine a hypothetical array rated at 6 kW DC with a 5 kW AC inverter. The numbers alone do not prove a mistake, and they do not prove a good design either. The designer must check voltage, current, thermal limits and expected operation using the exact equipment.
Ask what changes if a larger inverter is selected: installed cost, estimated energy, utility conditions and future expansion capability. Keep the comparison grounded in useful household energy and permitted exports. An upgrade that increases a rare peak may have a different value from one that resolves a genuine recurring constraint.
Know when a plateau needs service attention
Escalate a sudden new limit, repeated alarms, a plateau well below the documented expectation or a persistent unexplained fall in energy. Save before-and-after records and note any recent electrical work or settings changes. These observations help the installer distinguish a design feature from a developing issue.
Do not repeatedly reset equipment or disconnect components to test a theory. Qualified personnel should examine electrical and configuration causes. Ask for the diagnosis in writing and retain it with the system records, especially if settings or equipment are changed as part of the remedy.
Ask for clipping to be explained at handover
Request a sample explanation of normal output for your system, including the effect of any export limit. Keep the original model and inverter specifications accessible. This gives you a useful reference when seasonal conditions produce a graph you have not seen before.
Lightning Energy Philippines can explain whether an observed plateau is consistent with the documented design or needs investigation. Bring the full daily graph and operating information, not just a cropped peak. A clear diagnosis should connect the graph to a known limit and explain its practical effect on energy and household value.
Sources & further reading
Sources used for this guide. Policy and product details should be checked for your particular installation.
- National Laboratory of the Rockies — SAM Inverter Model and ClippingAccessed 27 September 2026
- National Laboratory of the Rockies — PVWatts Calculator and Model NotesAccessed 27 September 2026